Streaming Platform Integrations Reshaping Viewer Engagement with Live Poker Tournament Broadcasts
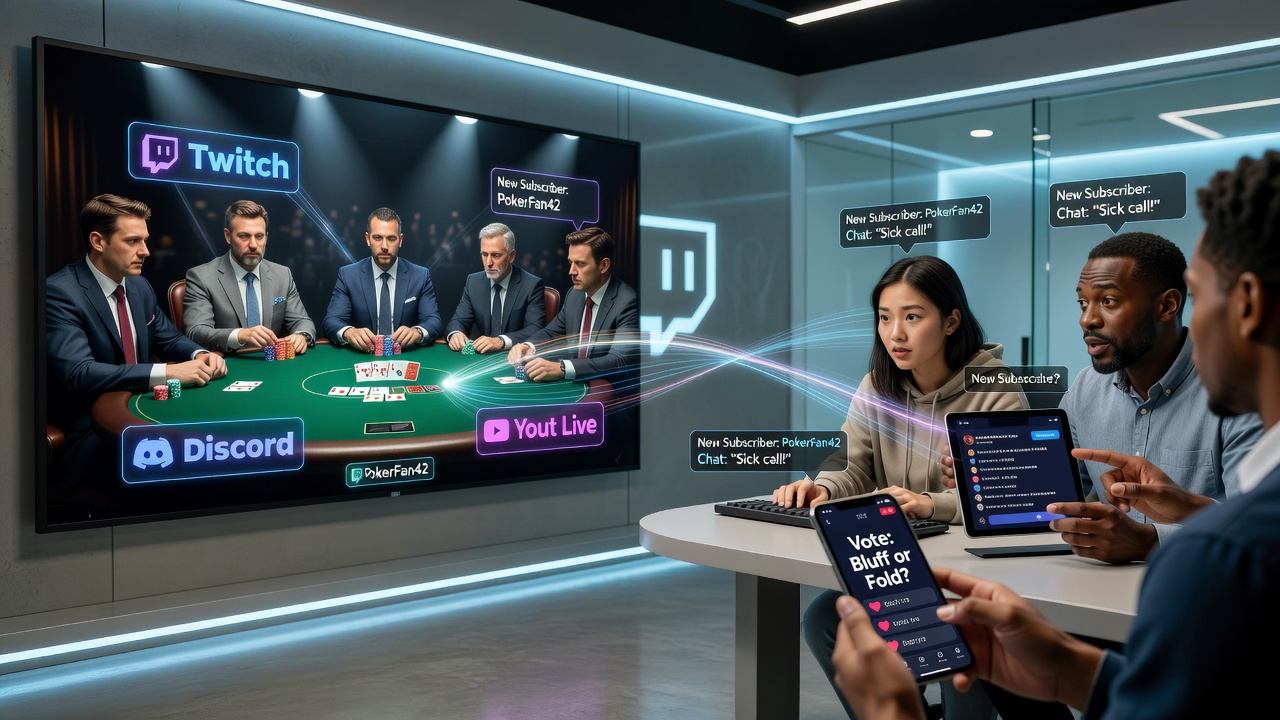
Streaming platforms have integrated directly with live poker tournament broadcasts through synchronized data feeds and interactive overlays that display real-time player statistics alongside the action on felt, and these connections allow viewers to track chip counts, hand histories, and probability calculations without switching away from the main feed. Data from industry reports shows that such features appeared more frequently after mid-2025 updates from major platforms, while July 2026 schedules for events like the World Series of Poker featured expanded partnerships that embedded viewer polls and multi-camera selections into the same interface. Observers note that engagement metrics rose as broadcasters combined traditional table coverage with platform-native tools, creating seamless experiences where audiences could access additional angles or historical data during breaks in play.
Real-Time Data Layers and Audience Retention Patterns
Integrations often include APIs that pull live tournament information into streaming dashboards, so viewers see updated odds and payout structures appear automatically as hands progress, and researchers tracking platform analytics found that sessions extended longer when these layers remained active throughout the broadcast. Figures reveal that retention rates climbed in tournaments using such tools because participants in the audience could follow multiple tables without losing context, whereas earlier formats required separate browser tabs or apps for the same details. What's interesting is how these overlays adapt to different regional regulations, with some broadcasts adjusting visibility of betting-related graphics depending on viewer location, yet the core engagement tools stayed consistent across events held in July 2026.
Interactive Elements Driving Participation Metrics
Chat functions merged with tournament feeds let audiences submit questions that commentators address during breaks, and case studies from several major circuits indicate that comment volume increased when platforms enabled threaded discussions tied to specific hands. One example involves a European event where integrated prediction tools allowed registered viewers to forecast outcomes on upcoming streets, after which aggregated results displayed on screen to compare against actual play. Data shows these features correlated with higher repeat viewership numbers, particularly among younger demographics that already spend significant time on the same platforms for other live content. But here's the thing: not every tournament adopted the full suite at once, so gradual rollouts helped broadcasters measure which elements produced the clearest lifts in time spent per user.
Multi-Platform Distribution and Cross-Device Viewing Trends
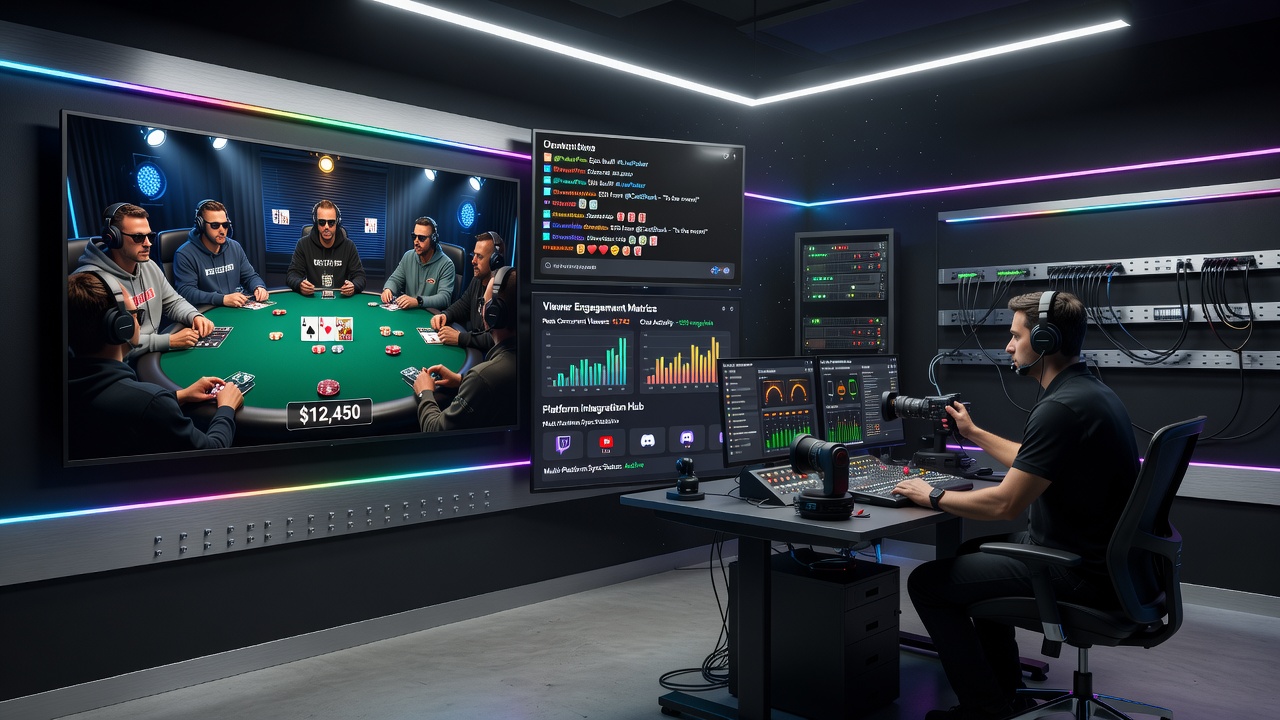
Broadcasters now push the same tournament signal to several streaming services simultaneously while maintaining synchronized overlays, which means a viewer on one platform can continue an uninterrupted session after switching devices mid-event. Reports compiled by gaming associations highlight that this flexibility contributed to broader geographic reach, with audiences in regions outside traditional poker markets accessing feeds through localized interfaces. In July 2026, several high-profile final tables incorporated embedded links to player profiles that updated automatically, giving context without requiring viewers to navigate away from the stream. Those who've studied these patterns note that completion rates for full tournaments improved when navigation remained within a single application environment rather than relying on external sites.
Challenges in Data Accuracy and Platform Compliance
Accurate synchronization between live action and digital overlays demands precise timing protocols, yet occasional delays in data transmission still occur during high-volume periods, and tournament organizers have responded by adding verification steps before graphics appear on screen. Industry organizations such as the European Gaming and Betting Association have documented best practices that reduce these lags through redundant feed systems. Compliance requirements also vary by jurisdiction, so platforms adjust which interactive elements appear based on local rules, which can affect the uniformity of viewer experiences across different countries. Research indicates that events maintaining consistent data standards across platforms recorded steadier engagement numbers even when some features were region-locked.
Future Integration Developments and Measurement Standards
Developers continue refining how augmented reality elements might layer additional information onto live streams without cluttering the primary view, while measurement frameworks now track not only watch time but also interaction frequency with specific tools. Academic studies from institutions monitoring digital media consumption have begun comparing engagement data across poker broadcasts and other live sports to identify transferable techniques. In July 2026, several circuits tested beta versions of personalized stat dashboards that viewers could configure based on preferred player focus, and early figures suggest these options further diversified audience behavior patterns during long sessions.
Conclusion
Streaming platform integrations continue to expand the ways audiences interact with live poker tournament broadcasts through combined data, chat, and distribution tools, and ongoing refinements in synchronization and compliance are shaping how these features evolve. Reports from sources including the American Gaming Association track corresponding shifts in viewership duration and geographic spread, while tournament organizers adapt formats to leverage the capabilities that platforms provide. These developments remain measurable through consistent analytics that capture both passive viewing and active participation across events held throughout 2026.